8.6 Ex: Regression
Let’s explore the relationship between the length of the sepal in an iris flower, and the length (cm) of it’s petal.
overall <- ggplot(iris, aes(x=Sepal.Length, y=Petal.Length)) +
                geom_point() + geom_smooth(se=FALSE) +
                theme_bw()

by_spec <- ggplot(iris, aes(x=Sepal.Length, y=Petal.Length, col=Species)) +
                  geom_point() + geom_smooth(se=FALSE) +
                  theme_bw() + theme(legend.position="top")

gridExtra::grid.arrange(overall, by_spec , ncol=2)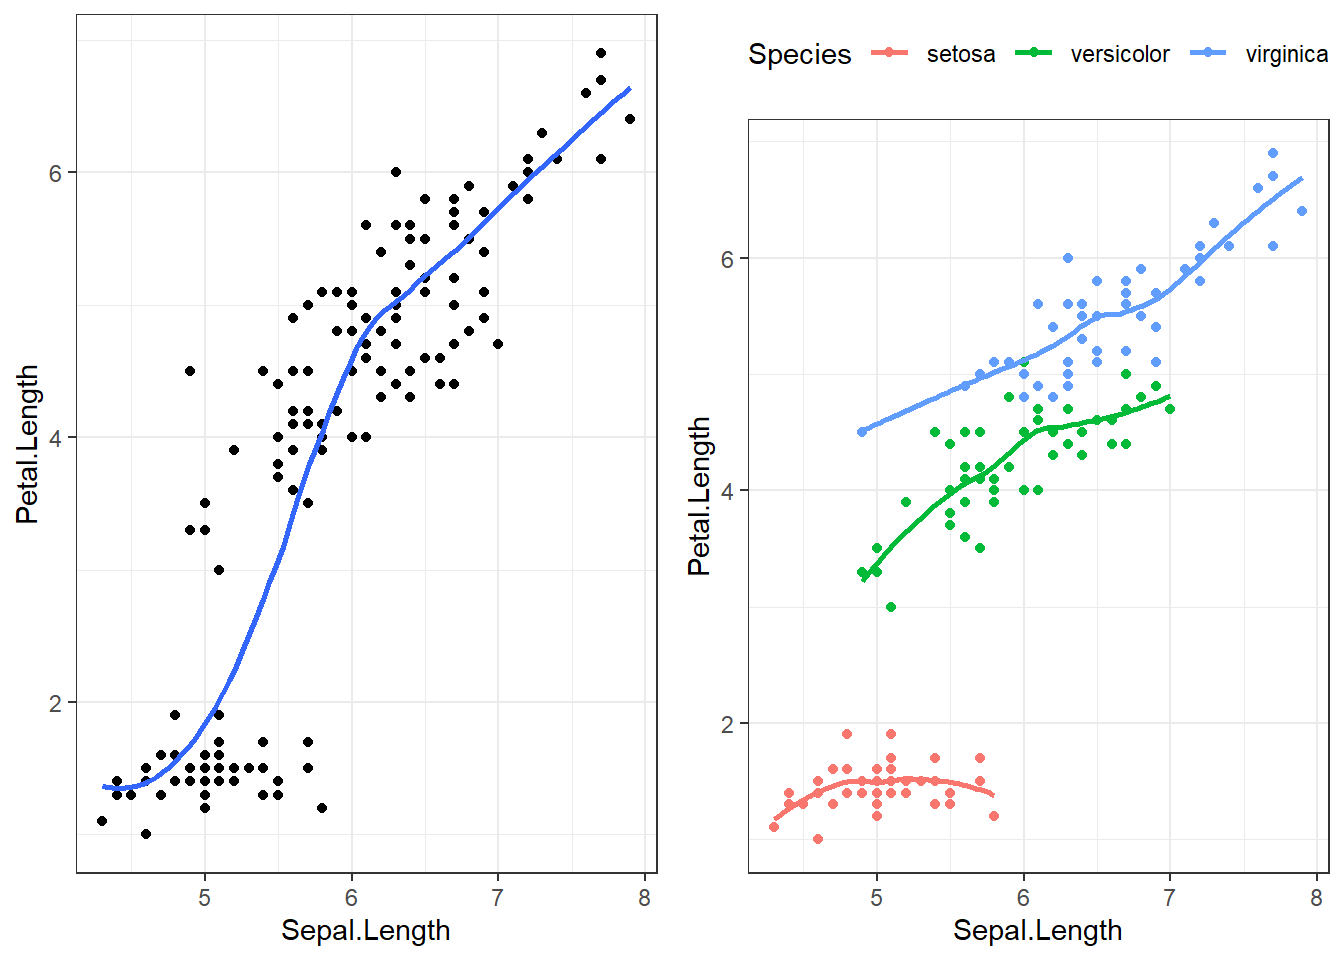
The points are clearly clustered by species, the slope of the lowess line between virginica and versicolor appear similar in strength, whereas the slope of the line for setosa is closer to zero. This would imply that petal length for Setosa may not be affected by the length of the sepal.
How does the species change the regression equation?
overall
lm(iris$Petal.Length ~ iris$Sepal.Length) |> summary() |> broom::tidy()
## # A tibble: 2 × 5
##   term              estimate std.error statistic  p.value
##   <chr>                <dbl>     <dbl>     <dbl>    <dbl>
## 1 (Intercept)          -7.10    0.507      -14.0 6.13e-29
## 2 iris$Sepal.Length     1.86    0.0859      21.6 1.04e-47
stratified by species
by(iris, iris$Species, function(x) {
  lm(Petal.Length ~ Sepal.Length, data = x) |> summary() |> broom::tidy()
  })
## iris$Species: setosa
## # A tibble: 2 × 5
##   term         estimate std.error statistic p.value
##   <chr>           <dbl>     <dbl>     <dbl>   <dbl>
## 1 (Intercept)     0.803    0.344       2.34  0.0238
## 2 Sepal.Length    0.132    0.0685      1.92  0.0607
## ------------------------------------------------------------
## iris$Species: versicolor
## # A tibble: 2 × 5
##   term         estimate std.error statistic  p.value
##   <chr>           <dbl>     <dbl>     <dbl>    <dbl>
## 1 (Intercept)     0.185    0.514      0.360 7.20e- 1
## 2 Sepal.Length    0.686    0.0863     7.95  2.59e-10
## ------------------------------------------------------------
## iris$Species: virginica
## # A tibble: 2 × 5
##   term         estimate std.error statistic  p.value
##   <chr>           <dbl>     <dbl>     <dbl>    <dbl>
## 1 (Intercept)     0.610    0.417       1.46 1.50e- 1
## 2 Sepal.Length 0.750 0.0630 11.9 6.30e-16- Overall: -7.1 + 1.86x, significant positive slope p = 1.04x10-47
- Setosa: 0.08 + 0.13x, non-significant slope, p=.06
- Versicolor: 0.19 + 0.69x, significant positive slope p=2.6x10⁻¹⁰
- Virginica: 0.61 + 0.75x, significant positive slope p= 6.3x10⁻¹⁶
So we can say that iris specis moderates the relationship between sepal and petal length.