16.1 Example School Data
The data used in this first example comes from a publicly available data set called the National Education Longitudinal Study of 1988 (yes it’s a bit old data, but sufficient for our purposes here). In this data set math scores are recorded for 519 students from 23 schools.
 List a few characteristics that you think are associated with math performance, and at what level they are measured.
The School23 data set contains the following variables:
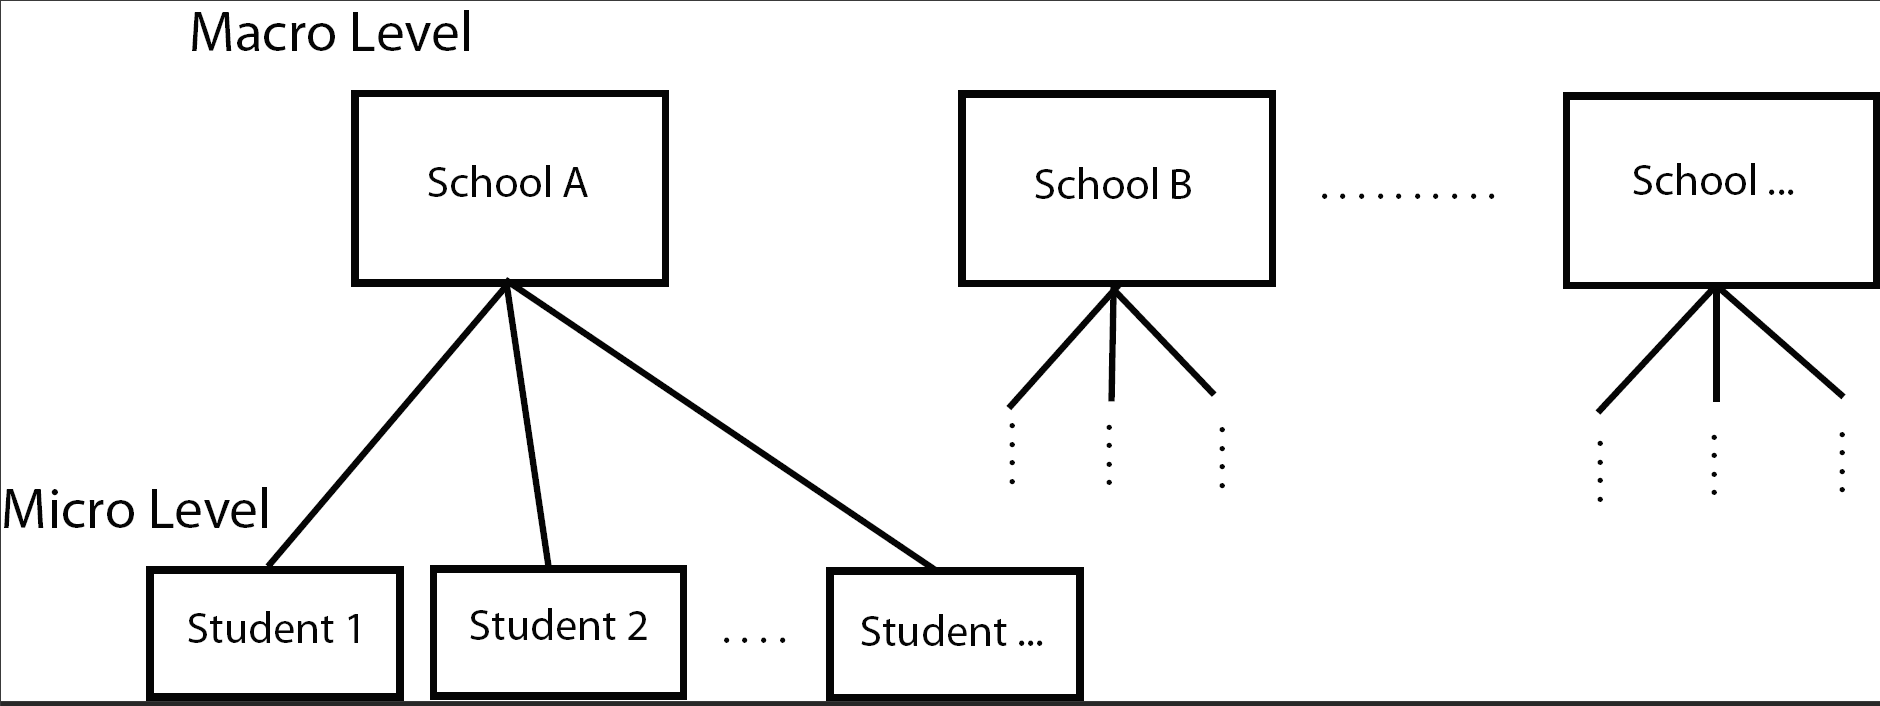
- School (macro) level variables
- School type
- class structure
- school size
- urbanity
- geographic region
- percent minority
- student-teacher ratio
- Student (micro) level variables
- Gender
- Race
- Time spent on math homework
- SES
- parental education
- math score
Imagine a model of math score based on school type (\(X_{1}\) 1 for public, 0 for private) and SES (\(X_{2}\)).
\[ Y_{i} = \beta_{0} + \beta_{1}X_{1i} + \beta_{2}X_{2i} + \epsilon_{i}, \qquad i = 1, \ldots, n=519 \]
This model does not take into the account the hierarchical nature of the data in that students are nested within schools. School type is a macro level variable, SES is a micro level variable. We could consider adding indicator variables for each of the 23 schools to create a Fixed Effects model,
\[ Y_{i} = \beta_{0} + \beta_{1}(SchoolType)_{1i} + \beta_{2}(SES)_{2i} + \beta_{3}(School2)_{i} + \ldots + \beta_{24}(School23)_{i} + \epsilon_{i} \]
but we already are well aware of fitting models with that many parameters, and when some school only have a few students in them. So we need a different model.