2.6 Multiple plots per window
base
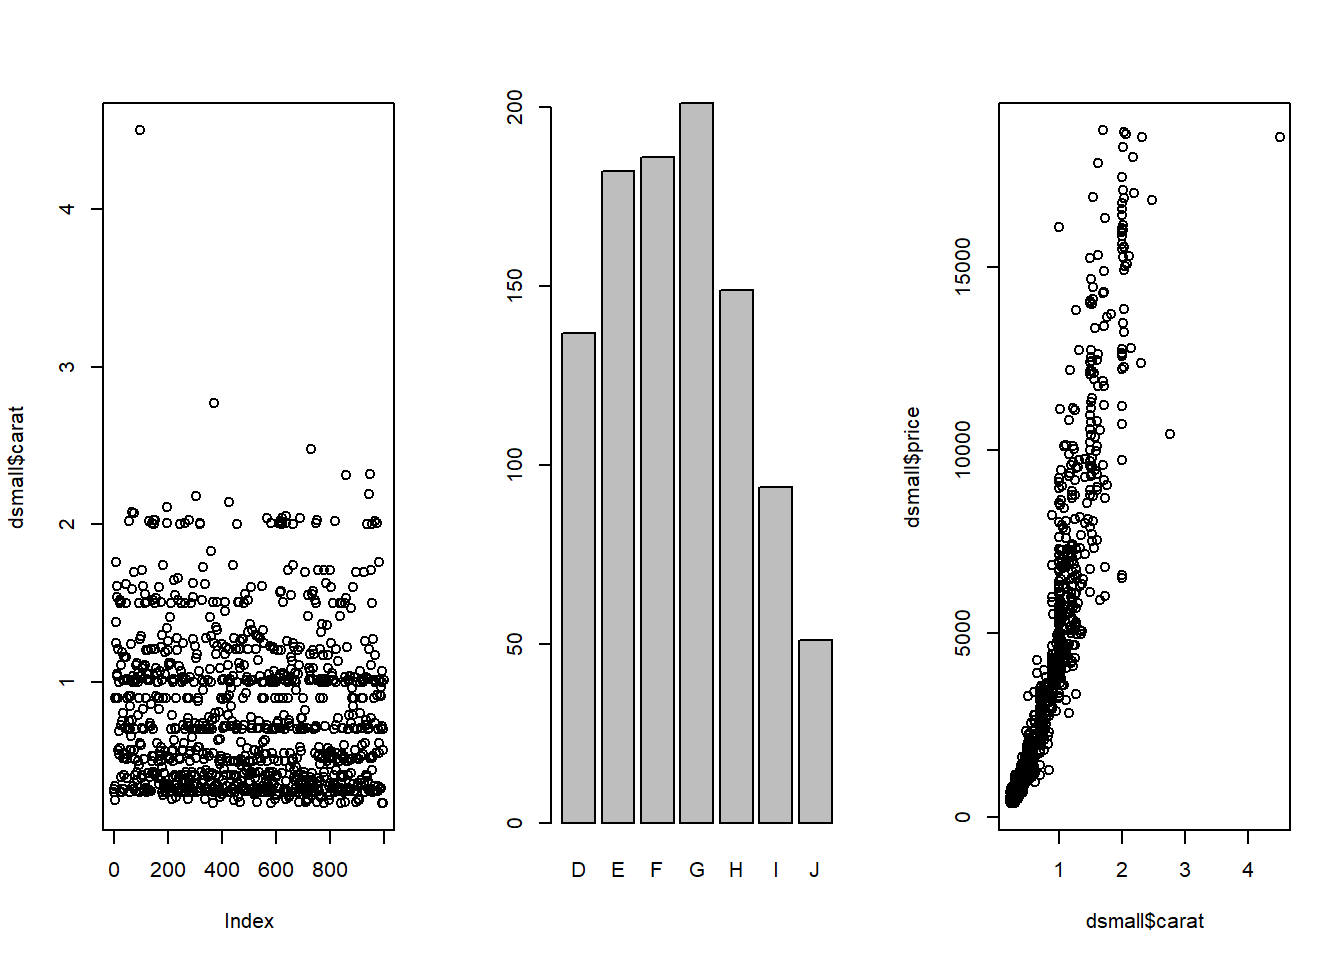
I use par(mfrow=c(r,c)) for base graphics, where r is the number of rows and c the number of columns.
Other resources including learning about layouts. Multipanel plotting with base graphics http://seananderson.ca/courses/11-multipanel/multipanel.pdf
ggplot
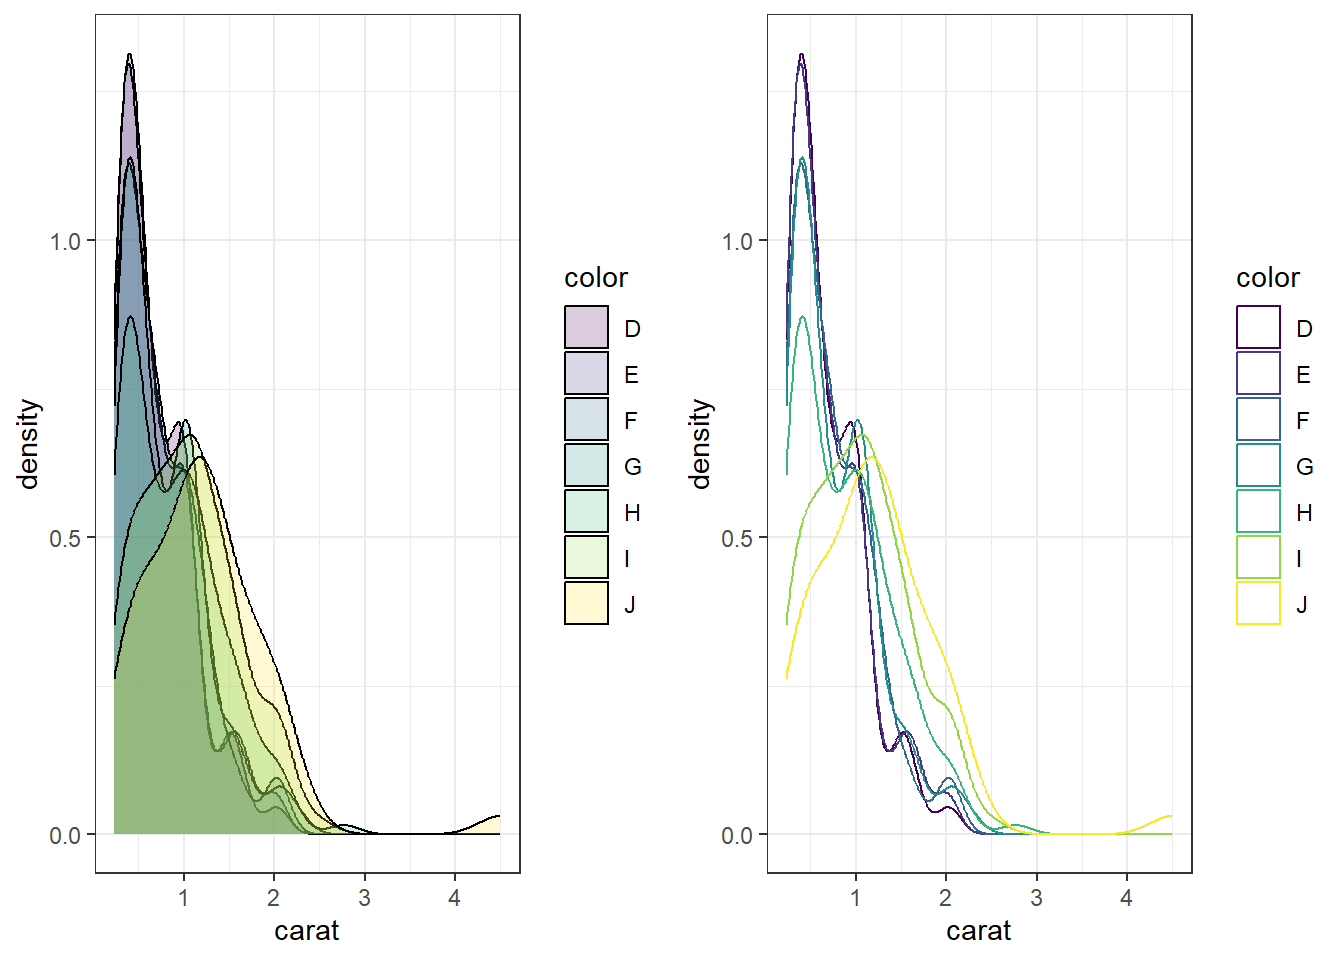
Use the grid.arrange function in the gridExtra package. I’ve done it several times above. You assign the output of a ggplot object to an object (here it’s plot1 and plot2). Then you use grid.arrange() to arrange them either side by side or top and bottom.
a <- ggplot(dsmall, aes(x=carat, fill=color)) + geom_density(alpha=.2)
b <- ggplot(dsmall, aes(x=carat, col=color)) + geom_density()
grid.arrange(a,b, ncol=2)