5.6 (Q~Q) Correlation
The correlation coefficient is designated by \(r\) for the sample correlation, and \(\rho\) for the population correlation. The correlation is a measure of the strength and direction of a linear relationship between two variables.
The correlation ranges from +1 to -1. A correlation of +1 means that there is a perfect, positive linear relationship between the two variables. A correlation of -1 means there is a perfect, negative linear relationship between the two variables. In both cases, knowing the value of one variable, you can perfectly predict the value of the second.
5.6.1 Strength of the correlation
Here are rough estimates for interpreting the strengths of correlations based on the magnitude of \(r\).
- \(|r| \geq 0.7\): Very strong relationship
- \(0.4 \leq |r| < 0.7\): Strong relationship
- \(0.3 \leq |r| < 0.4\): Moderate relationship
- \(0.2 \leq |r| < 0.3:\) Weak relationship
- \(|r| < 0.2:\) Negligible or no relationship
5.6.2 Example: Federal spending per capita and poverty rate
ggplot(county, aes(x=poverty, y=fed_spend00)) +
  geom_point() + ylab("federal spending per capita") +
  xlab("poverty rate")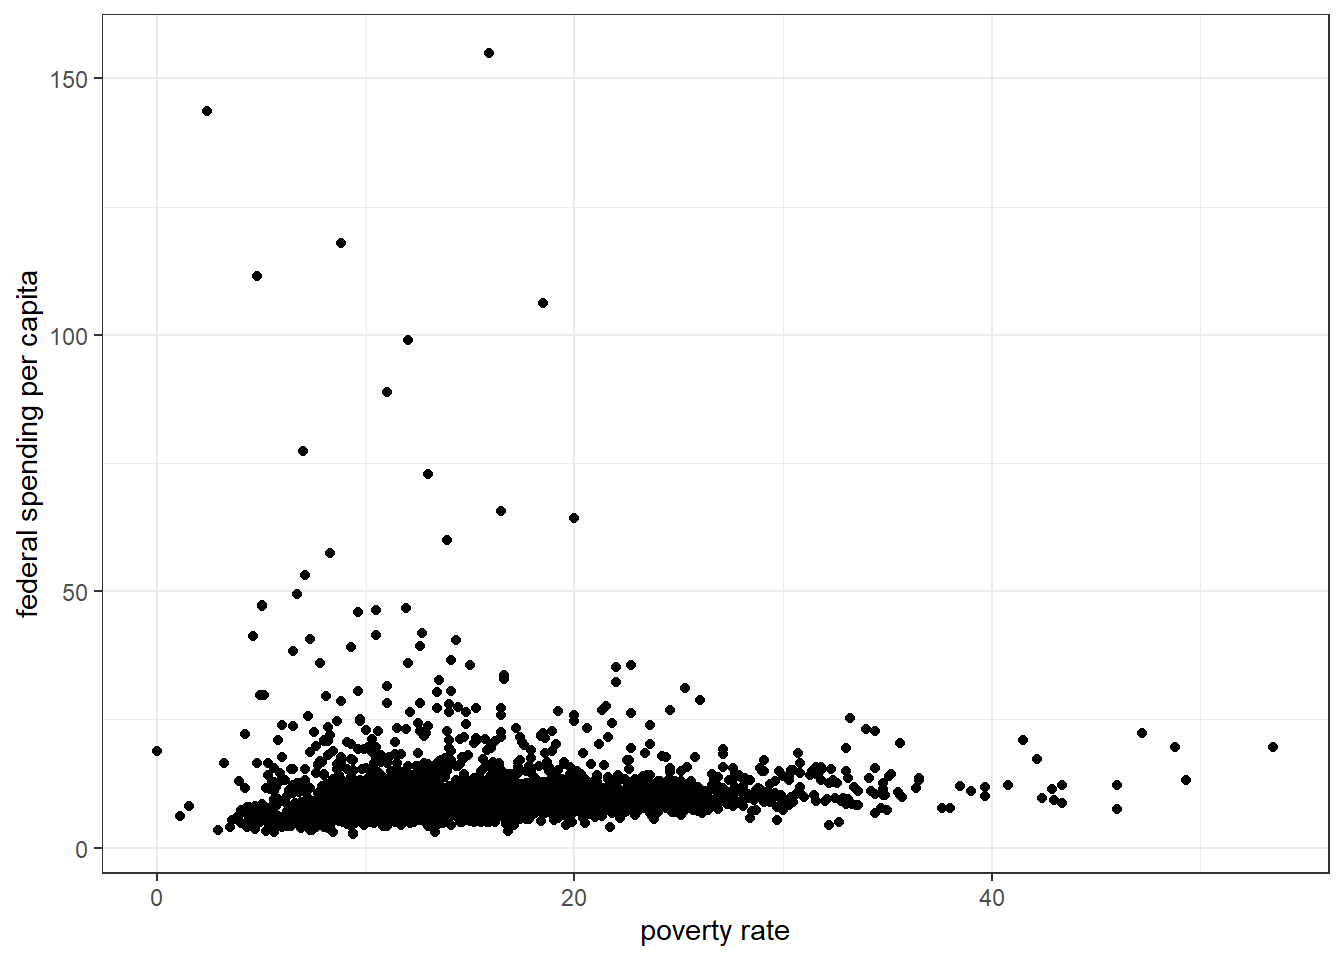
- There is a negligible, positive, linear relationship between poverty rate and per capita federal spending (\(r = 0.03\)).
- Let \(\rho\) denote the true correlation between poverty rate and federal spending per capita.
- Our null hypothesis is that there is no correlation between poverty rate and federal spending (\(\rho = 0\)), and the alternative hypothesis is that they are correlated (\(\rho \neq 0\)).
- We can use the
cor.test()function to analyze the evidence in favor of this alternative hypothesis.
cor.test(county$poverty, county$fed_spend00)
##
##  Pearson's product-moment correlation
##
## data:  county$poverty and county$fed_spend00
## t = 1.9444, df = 3110, p-value = 0.05194
## alternative hypothesis: true correlation is not equal to 0
## 95 percent confidence interval:
##  -0.0002922843  0.0698955658
## sample estimates:
##        cor
## 0.03484461
We conclude from this that there was a non-statistically significant, negligible correlation between poverty and federal spending (\(r = 0.03 (-0.0003, .069), p = 0.05\)).