11.5 Count outcome data
Lets consider modeling the distribution of the number of of occurrences of a rare event in a specified period of time - e.g. Number of thunderstorms in a year
- If we assume:
- Rate (\(\mu\)) is fixed over time
- Successive occurrences independent of each other
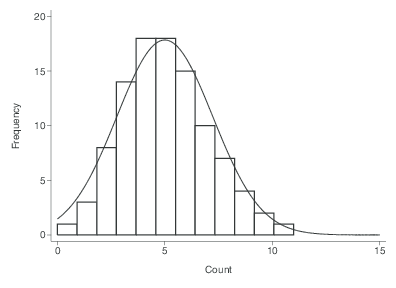
Then we can use the Poisson distribution.
\[ P(Y=y) = e^{-\mu}\frac{\mu^{y}}{y!} \]
- The Poisson distribution has a distinct feature where the mean of the distribution \(\mu\), is also the variance.
11.5.0.1 Poisson Regression
Just another GLM - we use a \(ln\) as the link function. This lets us model the log rates using a linear combination of covariates.
\[ ln(\mu) = \mathbf{X}\beta \]
Then the expected rate of events per unit of time is:
\[ \mu = e^{\mathbf{X}\beta} \]
This model assumes that the time of “exposure” for each record is identical.
- Number of cigarettes per month
- Number of epileptic seizures per week
- Number of people with lung cancer in four cities
If this is not the case (often), then this model needs to include an offset.
- e.g. observing each patient for epileptic seizures for a different number of days
- accounting for different sizes or structures of populations of interest (e.g. different cities with lung cancer)
What actually gets fit in glm is the model of expected counts, rather than rates, with an offset for the time period \(T\).
- If all time periods are the same, then T is constant, and a linear combination of the intercept, thus dropped from the model.
\[ ln(\lambda) = \mathbf{X}\beta + ln(T) \]
While this offset will be added to the regression model as if it were another variable, it’s not quite the same because the regression coefficient for the \(ln(T)\) term is fixed at 1.
The generic formula for fitting a poisson model using glm is:
or alternatively as an argument
The interpretation of the \(\beta\) regression coefficients are differences in the log rate (or the log rate-ratio). So, just like with a logistic regression often we back-transform the coefficients by exponentiating before interpreting. So \(e^{\beta}\) is now the rate-ratio.
- The intercept term is not a ratio, but a baseline rate when all covariates are 0
- For other covariates, the coefficient is the relative change per unit change in the covariate.
- one year older
- males vs females
Also, similar to logistic regression, since the outcome was transformed, the standard errors are not useful or interpretable as is. To calculate confidence intervals for the rate ratios,
- calculate the CI for \(\beta\)
- exponentiate each end point.
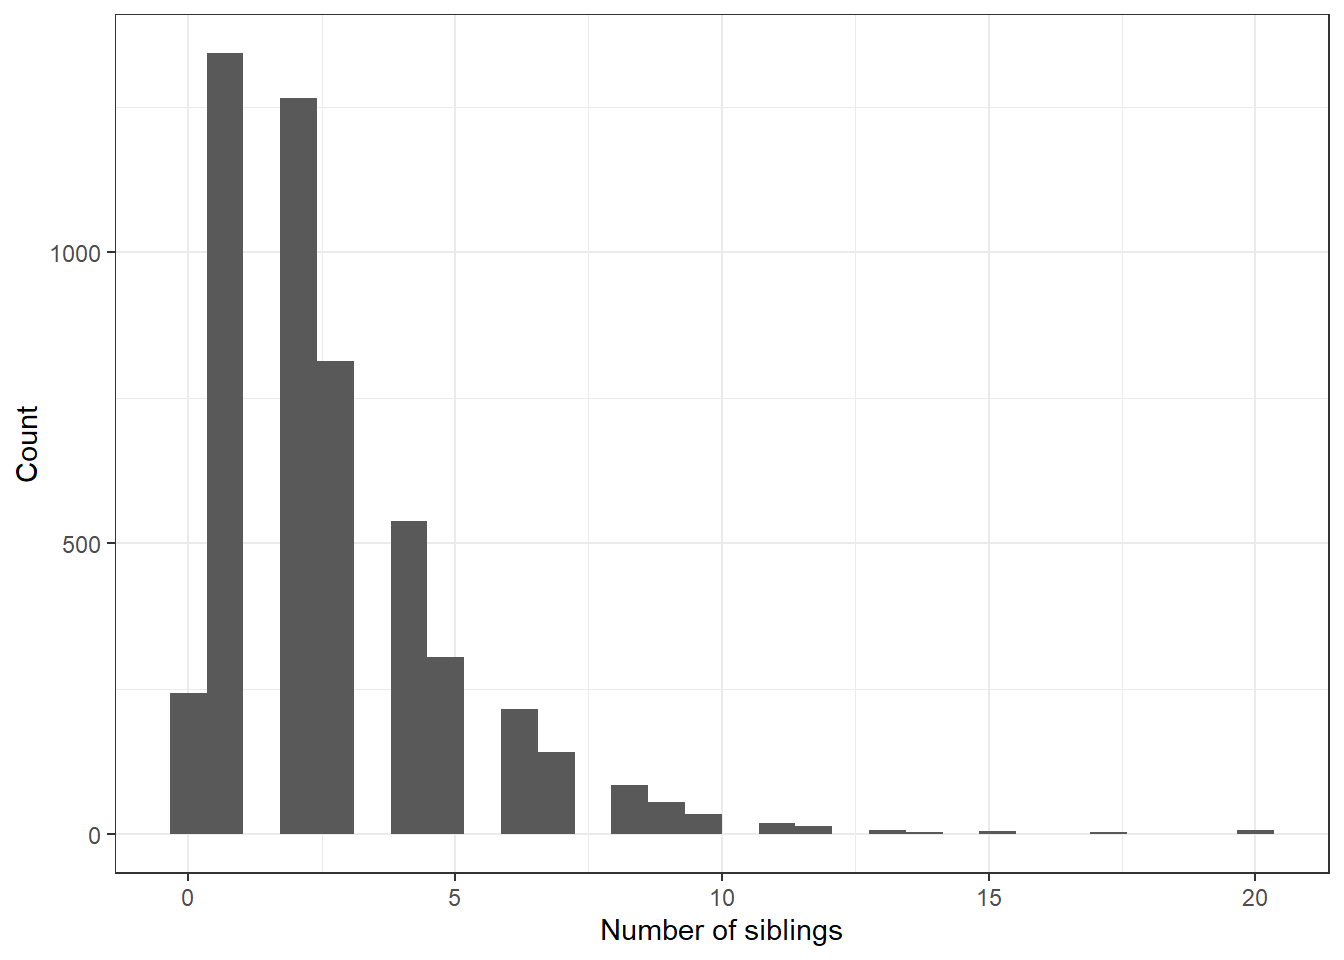
11.5.0.2 Example: Modeling counts from the Add Health Wave IV dataset.
Let’s model the number of siblings someone has, based off their age at Wave 1 (2008).
Visualize
nsib.model <- glm(nsib ~ agew1 + female, data=addhealth, family="poisson")
tbl_regression(nsib.model, exponentiate = TRUE)| Characteristic | IRR1 | 95% CI1 | p-value |
|---|---|---|---|
| agew1 | 1.05 | 1.03, 1.06 | <0.001 |
| female | 1.10 | 1.06, 1.14 | <0.001 |
| 1 IRR = Incidence Rate Ratio, CI = Confidence Interval | |||