14.5 Data Reduction
Corresponding reading: PMA6 Ch 14.5
- Keep first \(m\) principal components as representatives of original P variables
- Keep enough to explain a large percentage of original total variance.
- Ideally you want a small number of PC’s that explain a large percentage of the total variance.
14.5.1 Choosing \(m\)
- Rely on existing theory
- Explain a given % of variance (cumulative percentage plot)
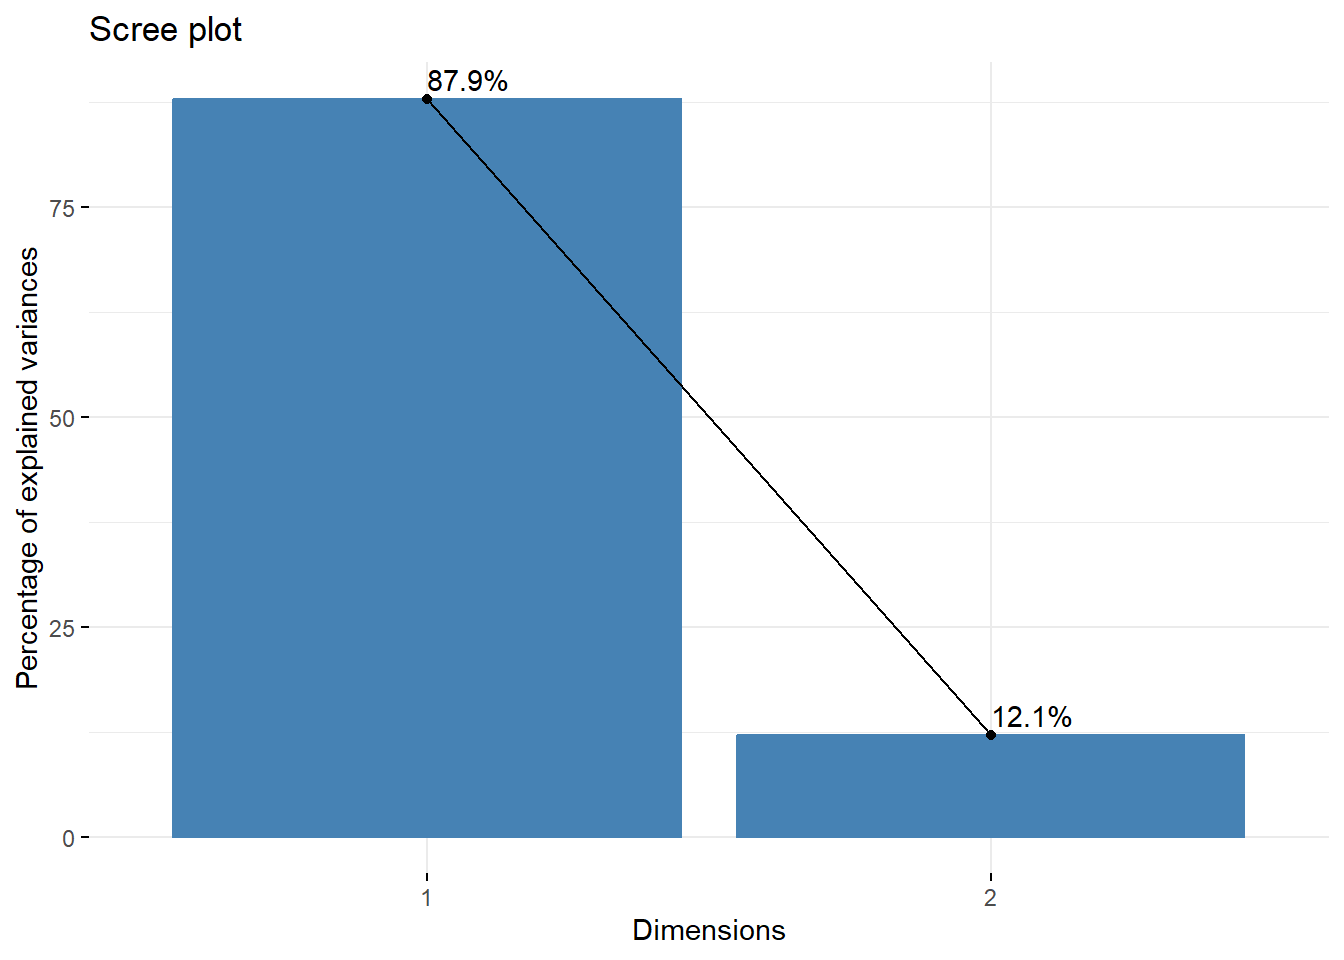
- All eigenvalues > 1 (Scree plot)
- Elbow rule (Scree Plot)
A Scree plot is created by plotting the eigenvalue against the PC number.
These are best understood using an example containing more than two PC’s, but there is one more thing to consider first and that is how the data is prepared before calculating the principal components.