8.6 Example 4: Chi-Squared
Identify response, explanatory, and moderating variables
- Categorical response variable = Ever smoked (variable
eversmoke_c - Categorical explanatory variable = General Health (variable
genhealth - Categorical Potential Moderator = Gender (variable
female5_c
Visualize the relationship between smoking and general health across the entire sample.
plot_xtab(addhealth$genhealth, addhealth$eversmoke_c,
          show.total = FALSE, margin = "row") +
  ggtitle("Overall")
fem <- addhealth %>% filter(female_c == "Female")
mal <- addhealth %>% filter(female_c == "Male")

fem.plot <- plot_xtab(fem$genhealth, fem$eversmoke_c,
          show.total = FALSE, margin = "row") +
  ggtitle("Females only")
mal.plot <- plot_xtab(mal$genhealth, mal$eversmoke_c,
          show.total = FALSE, margin = "row") +
  ggtitle("Males only")

gridExtra::grid.arrange(fem.plot, mal.plot)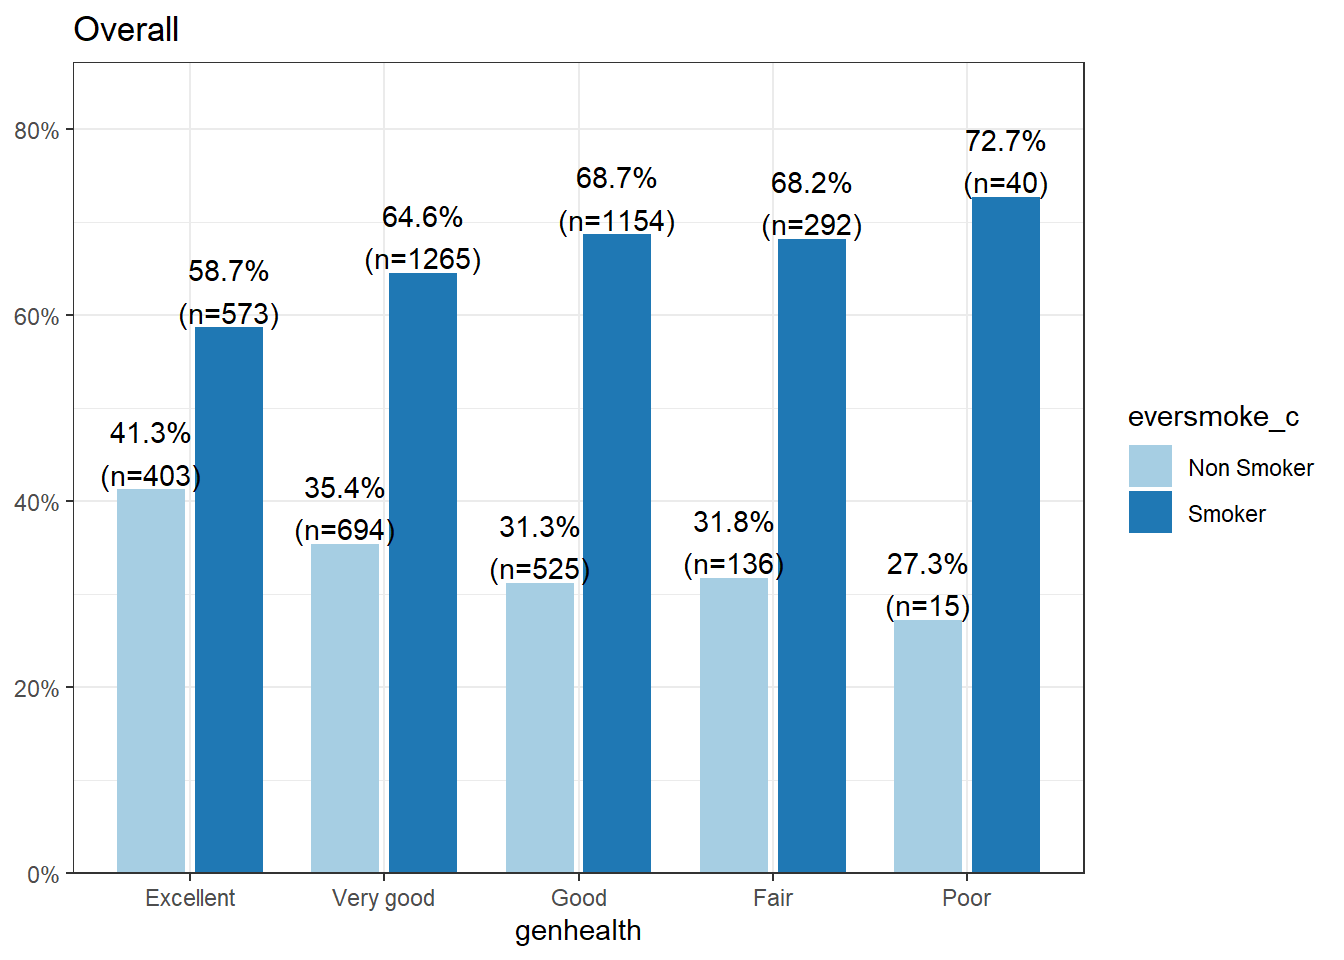
A general pattern is seen where the proportion of smokers increases as the level of general health decreases. This pattern is similar within males and females, but it is noteworthy that a higher proportion of non smokers are female.
 Does being female change the relationship between smoking and general health? Is the distribution of smoking status (proportion of those who have ever smoked) equal across all levels of general health, for both males and females?
Fit both the original, and stratified models.
original
chisq.test(addhealth$eversmoke_c, addhealth$genhealth)
##
##  Pearson's Chi-squared test
##
## data:  addhealth$eversmoke_c and addhealth$genhealth
## X-squared = 30.795, df = 4, p-value = 3.371e-06
stratified
by(addhealth, addhealth$female_c, function(x) chisq.test(x$eversmoke_c, x$genhealth))
## addhealth$female_c: Male
##
##  Pearson's Chi-squared test
##
## data:  x$eversmoke_c and x$genhealth
## X-squared = 19.455, df = 4, p-value = 0.0006395
##
## ------------------------------------------------------------
## addhealth$female_c: Female
##
##  Pearson's Chi-squared test
##
## data:  x$eversmoke_c and x$genhealth
## X-squared = 19.998, df = 4, p-value = 0.0004998
Determine if the Third Variable is a moderator or not.
The relationship between smoking status and general health is significant in both the main effects and the stratified model. The distribution of smoking status across general health categories does not differ between females and males. Gender is not a moderator for this analysis.