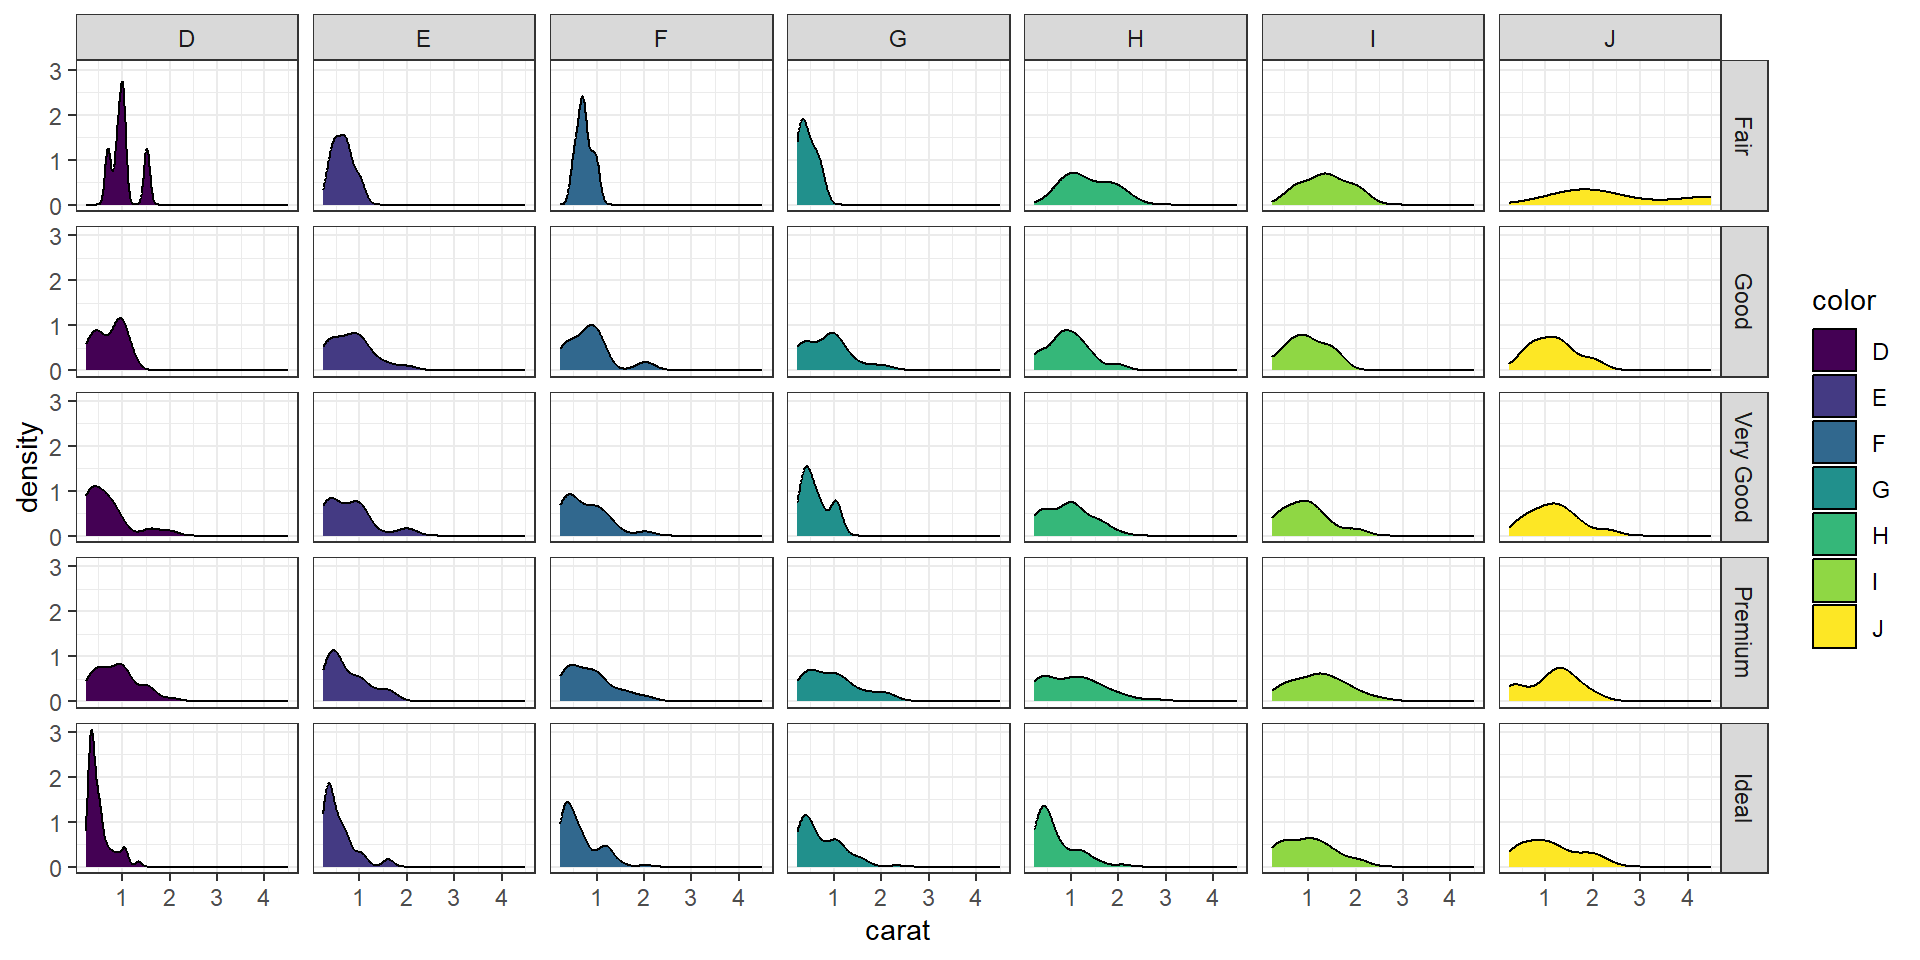
2.8 Paneling on two variables
Who says we’re stuck with only faceting on one variable? A variant on facet_wrap is facet_grid. Here we can specify multiple variables to panel on.
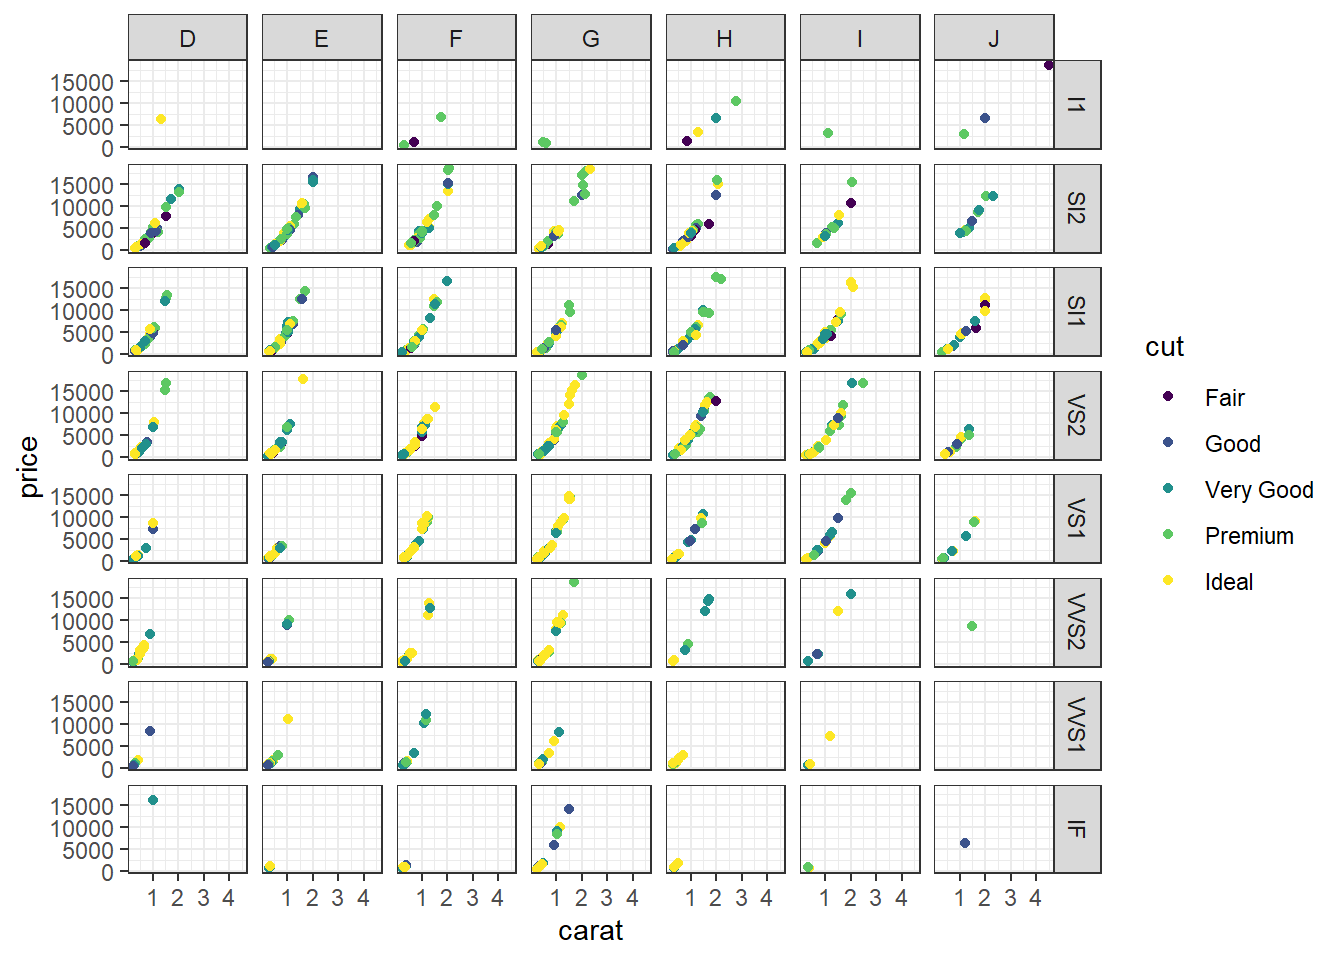
How about plotting price against caret, for all combinations of color and clarity, with the points further separated by cut?
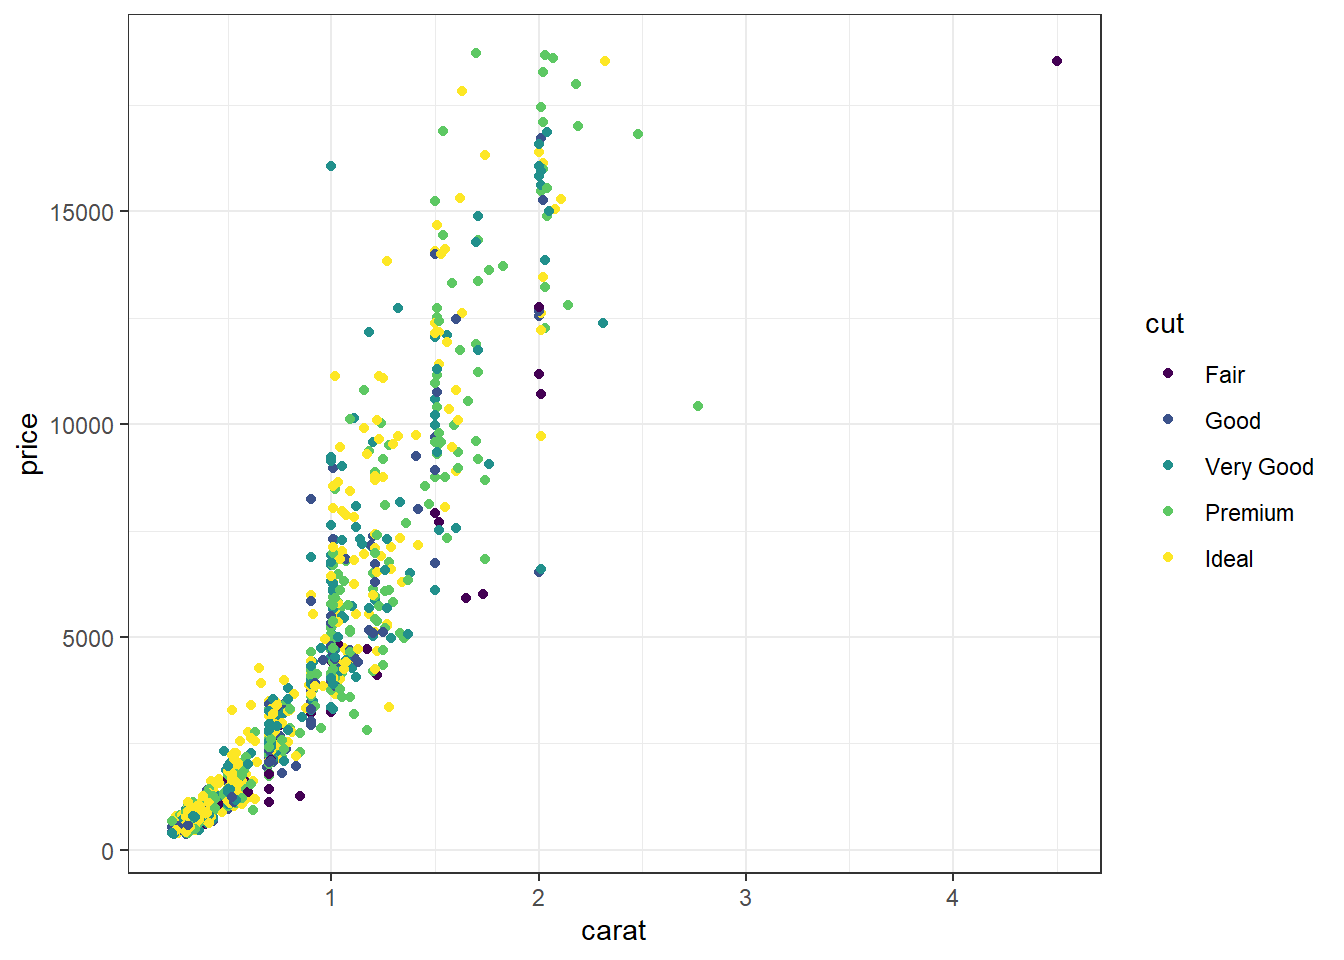
And lastly let’s look back at how we can play with scatterplots of using a third categorical variable (using ggplot2 only). We can color the points by cut,
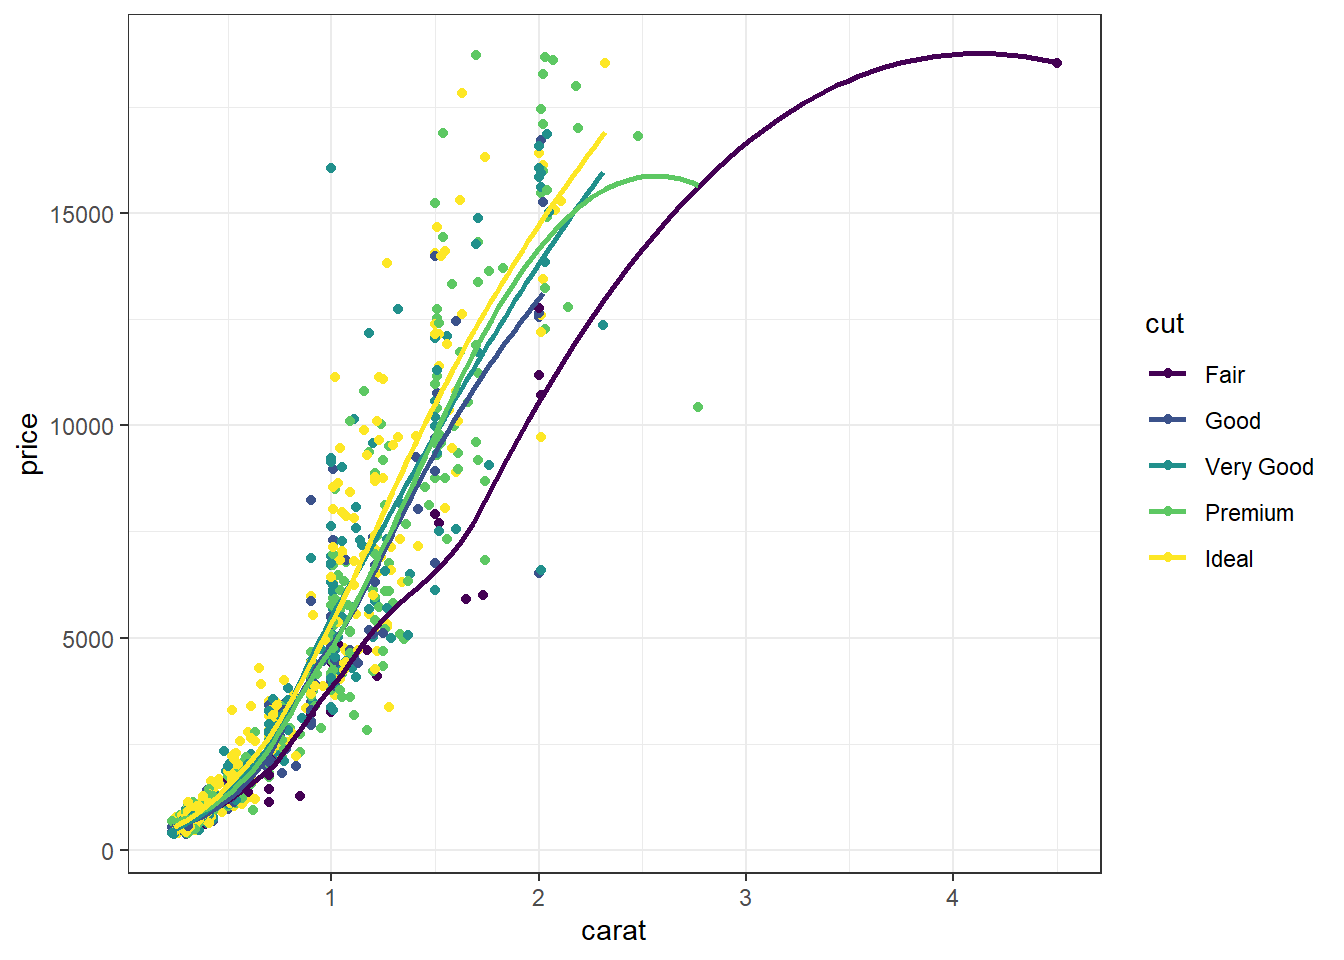
We could add a smoothing lowess line for each cut separately,
We could change the color by clarity, and shape by cut.
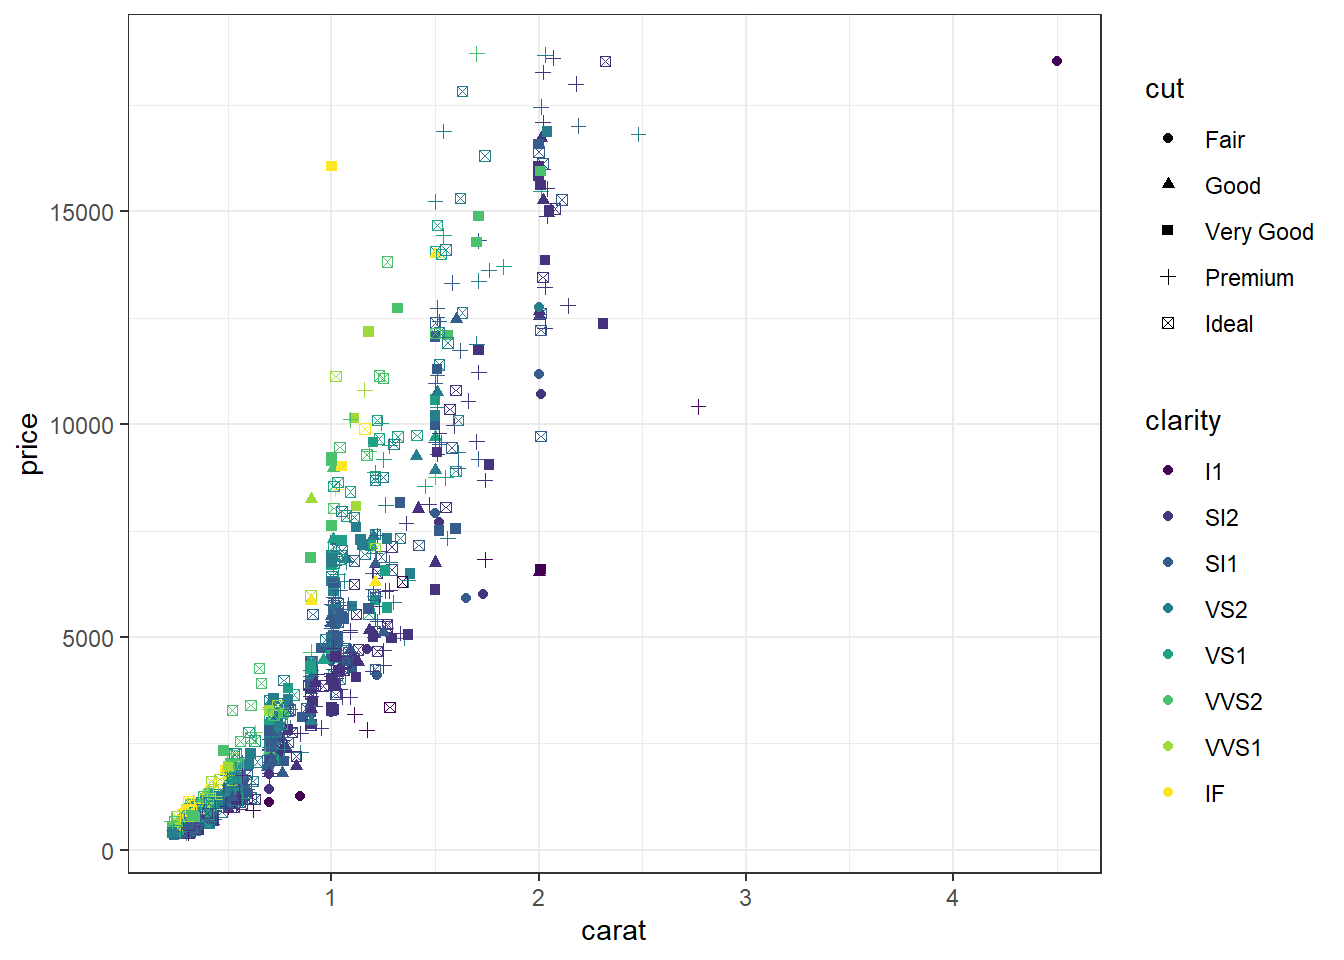
That’s pretty hard to read. So note that just because you can change an aesthetic, doesn’t mean you should. And just because you can plot things on the same axis, doesn’t mean you have to.
Before you share your plot with any other eyes, always take a step back and try to explain what it is telling you. If you have to take more than a minute to get to the point then it may be too complex and simpler graphics are likely warranted.