2.9 Troubleshooting
Problem: Missing data showing up as a category in ggplot?
Get rid of that far right bar!
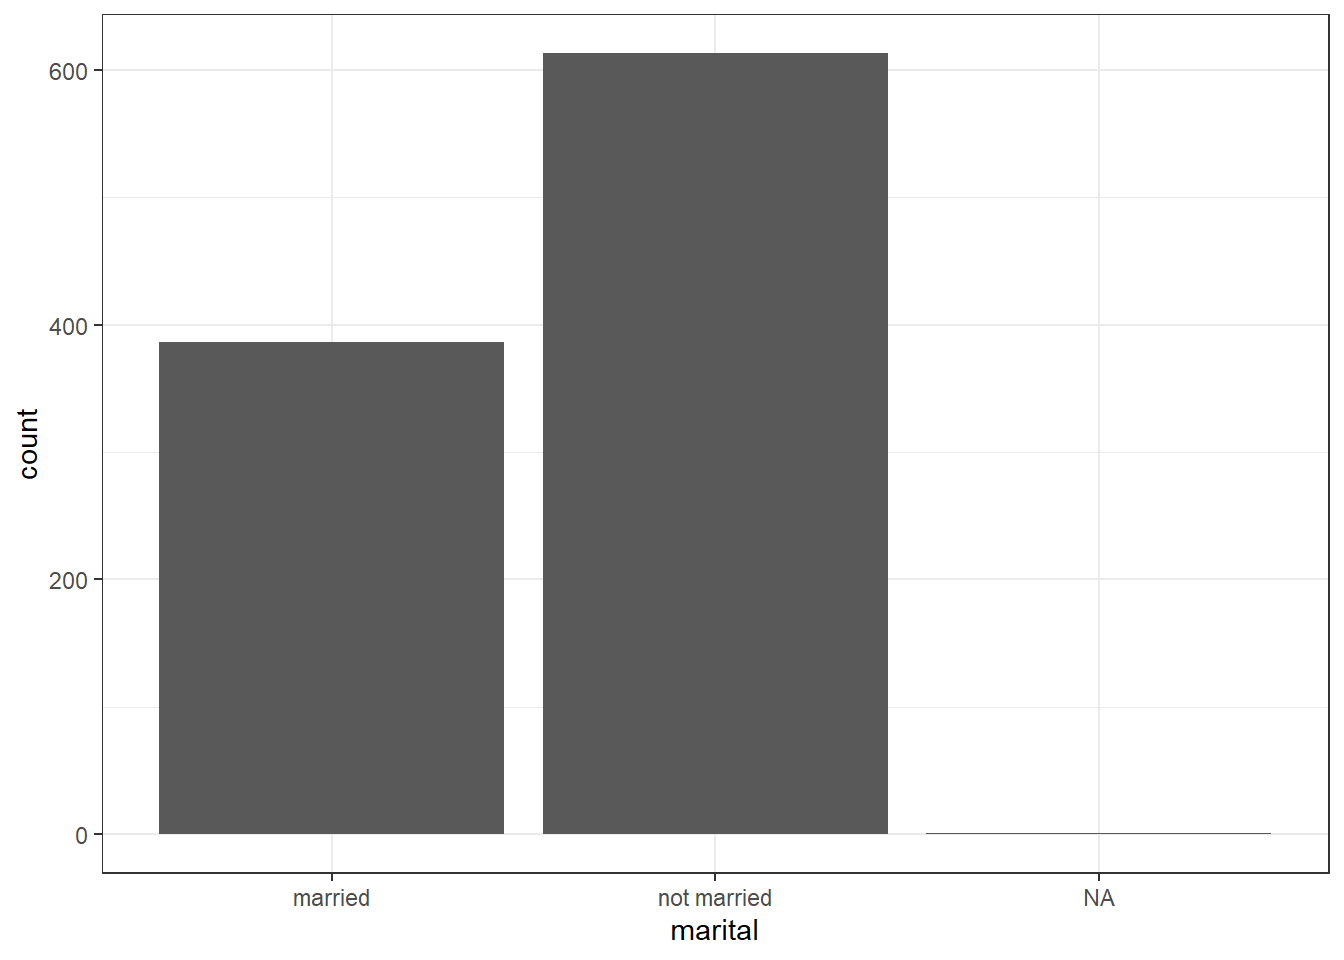
Solution: Use dplyr to select only the variables you are going to plot, then pipe in the na.omit() at the end. It will create a temporary data frame (e.g) plot.data that you then provide to ggplot().
plot.data <- NCbirths %>% select(marital) %>% na.omit()
ggplot(plot.data, aes(x=marital)) + geom_bar()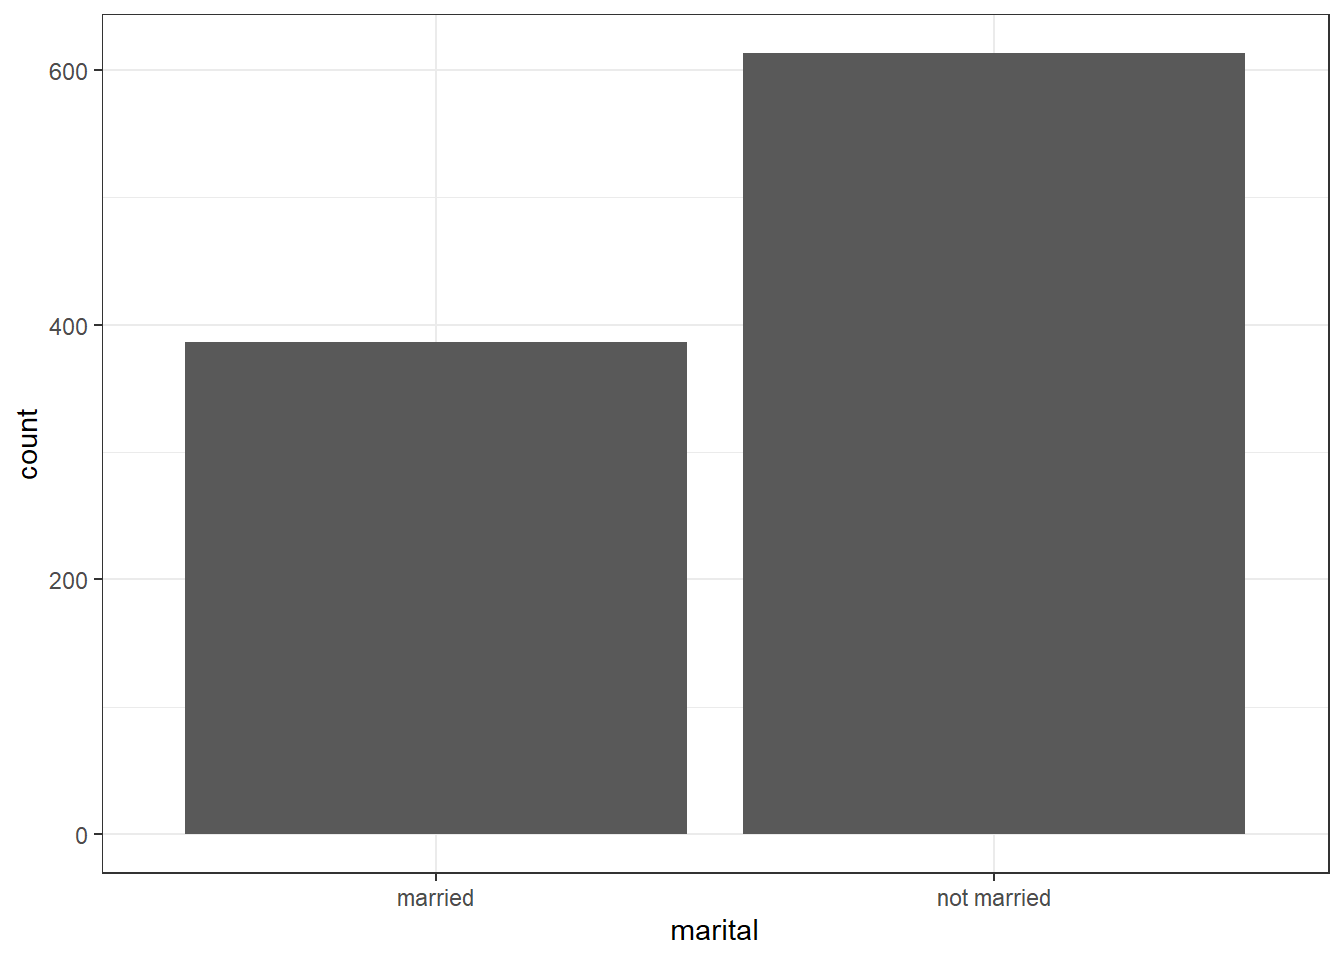
Problem: Got numerical binary 0/1 data but want to plot it as categorical? > Other related error messages: > * Continuous x aesthetic – did you forget aes(group=…)?
Consider a continuous variable for the number of characters in an email num_char, and a 0/1 binary variable spam.
Solution: Create a second variable var_factor for plotting and keep the binary var as 0/1 for analysis.
email$spam_cat <- factor(email$spam, labels=c("Ham", "Spam"))
ggplot(email, aes(y=num_char, x=spam_cat)) + geom_boxplot()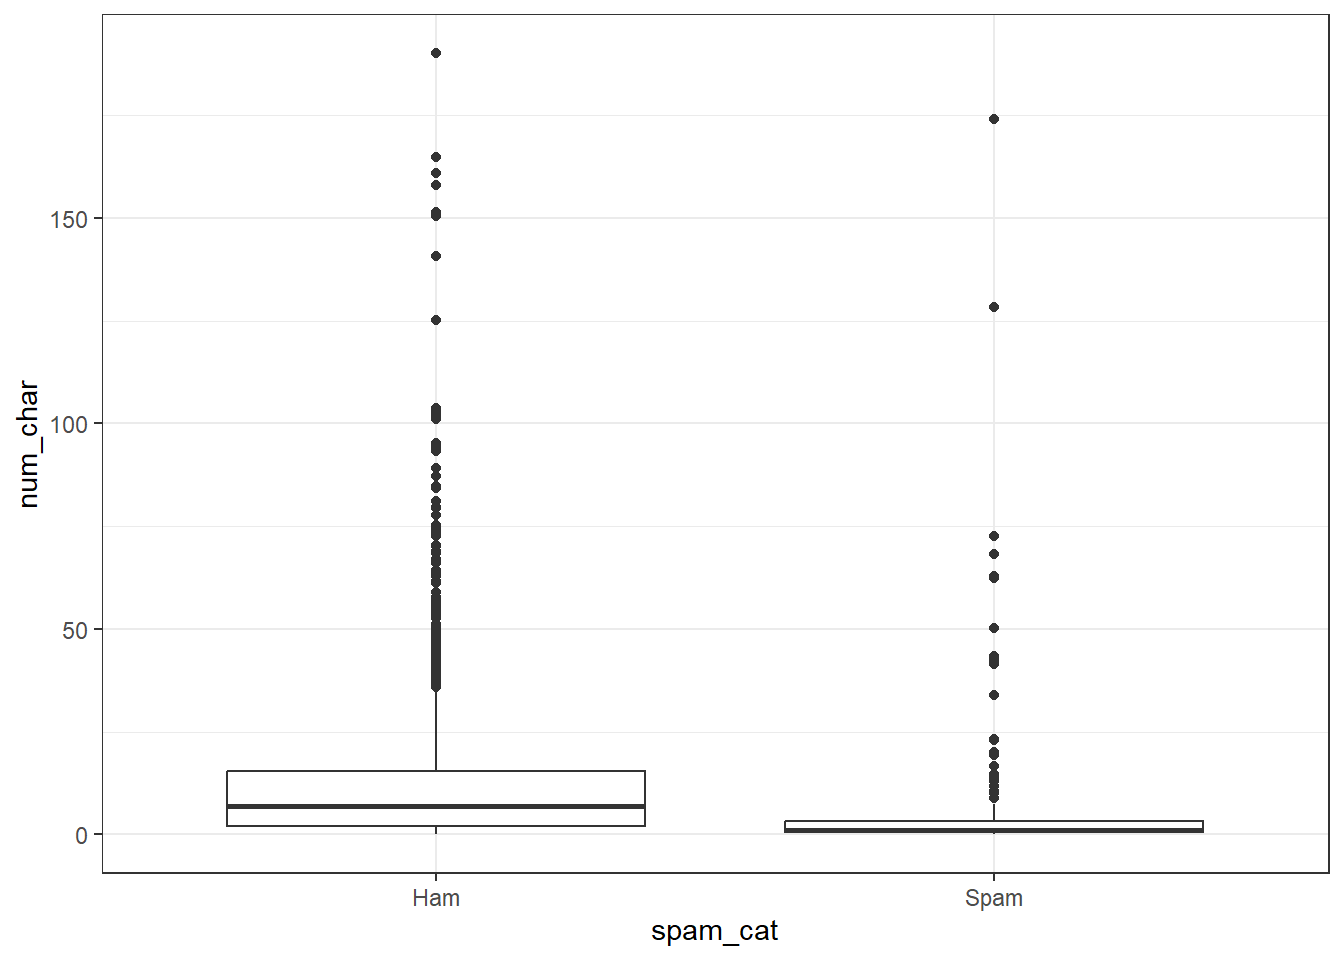
Problem: You want to change the legend title for a fill or color scale.
Solution: Add the name= argument to whatever layer you added that created the legend. Here I speciefied a fill, and it was a discrete variable. So I use the scale_fill_discrete() layer.
ggplot(email, aes(y=num_char, x=spam_cat, fill=spam_cat)) + geom_boxplot() +
  scale_fill_discrete(name="Ya like Spam?")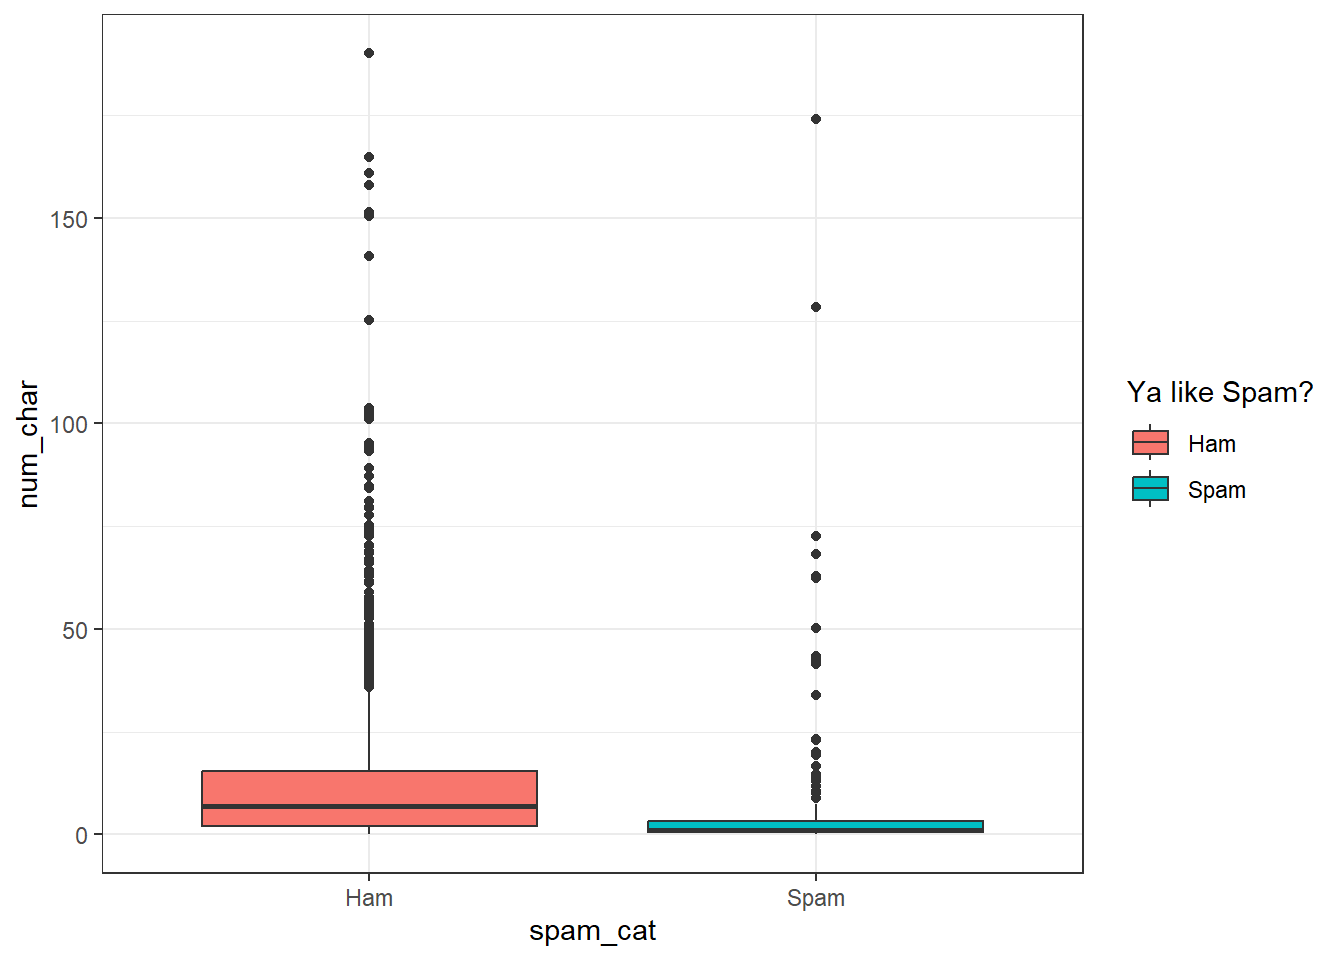
Here, I colored the points by a discrete variable, so the layer is scale_color_discrete().
ggplot(email, aes(x=num_char, y=line_breaks, col=spam_cat)) + geom_point() +
  scale_color_discrete(name="Ya like Spam?")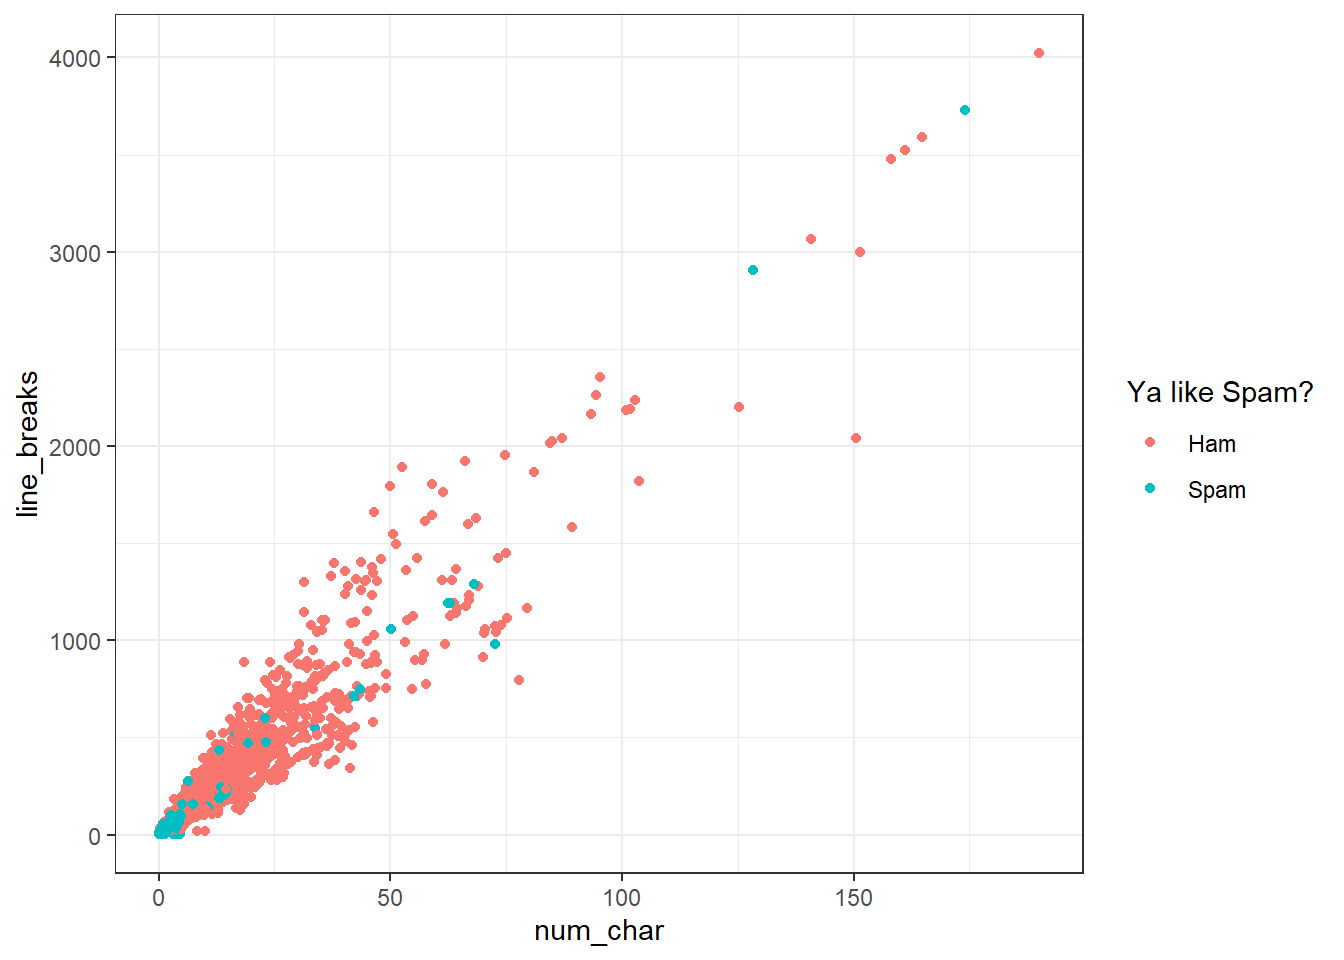
Problem: You want to add means to boxplots.
Boxplots are great. Even better with violin overlays. Know what makes them even better than butter? Adding a point for the mean. stat_summary is the layer you want to add. Check out this stack overflow post for more context.
ggplot(email, aes(x=spam_cat, y=num_char, fill=spam_cat)) +
  geom_boxplot() +
  stat_summary(fun.y="mean", geom="point", size=3, pch=17,color="blue")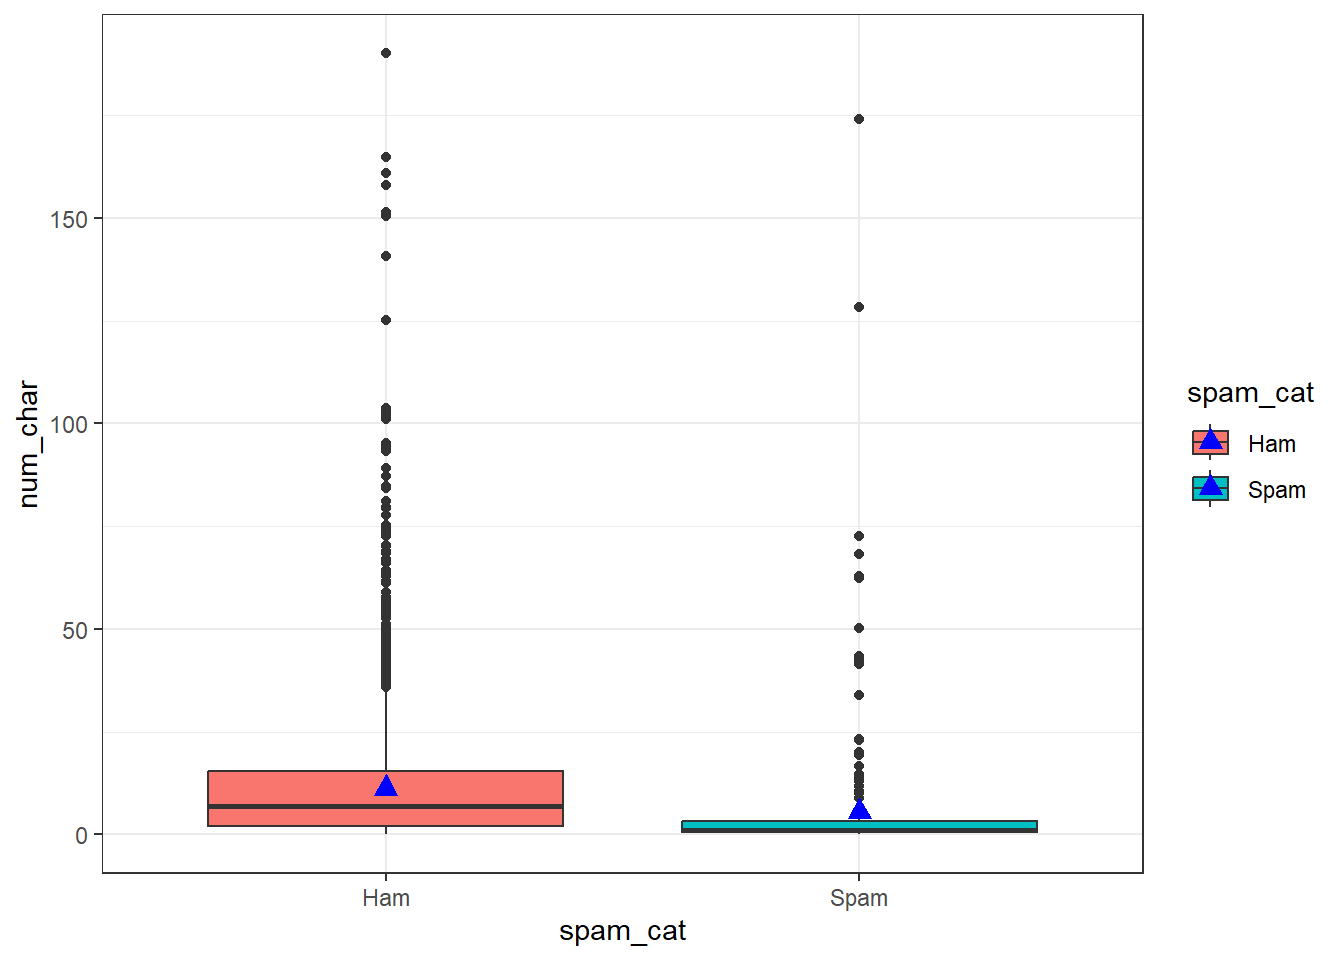
I suggest playing around with size and plotting character pch to get a feel for how these work. You can also look at ?pch (and scroll down in the help file) to see the 25 default plotting characters.