8.5 Ex: Correlation
Can we predict penguin body mass from the flipper length?
ggscatter(pen, x="flipper_length_mm", y = "body_mass_g", add = "reg.line",
          color = "island", ellipse = TRUE)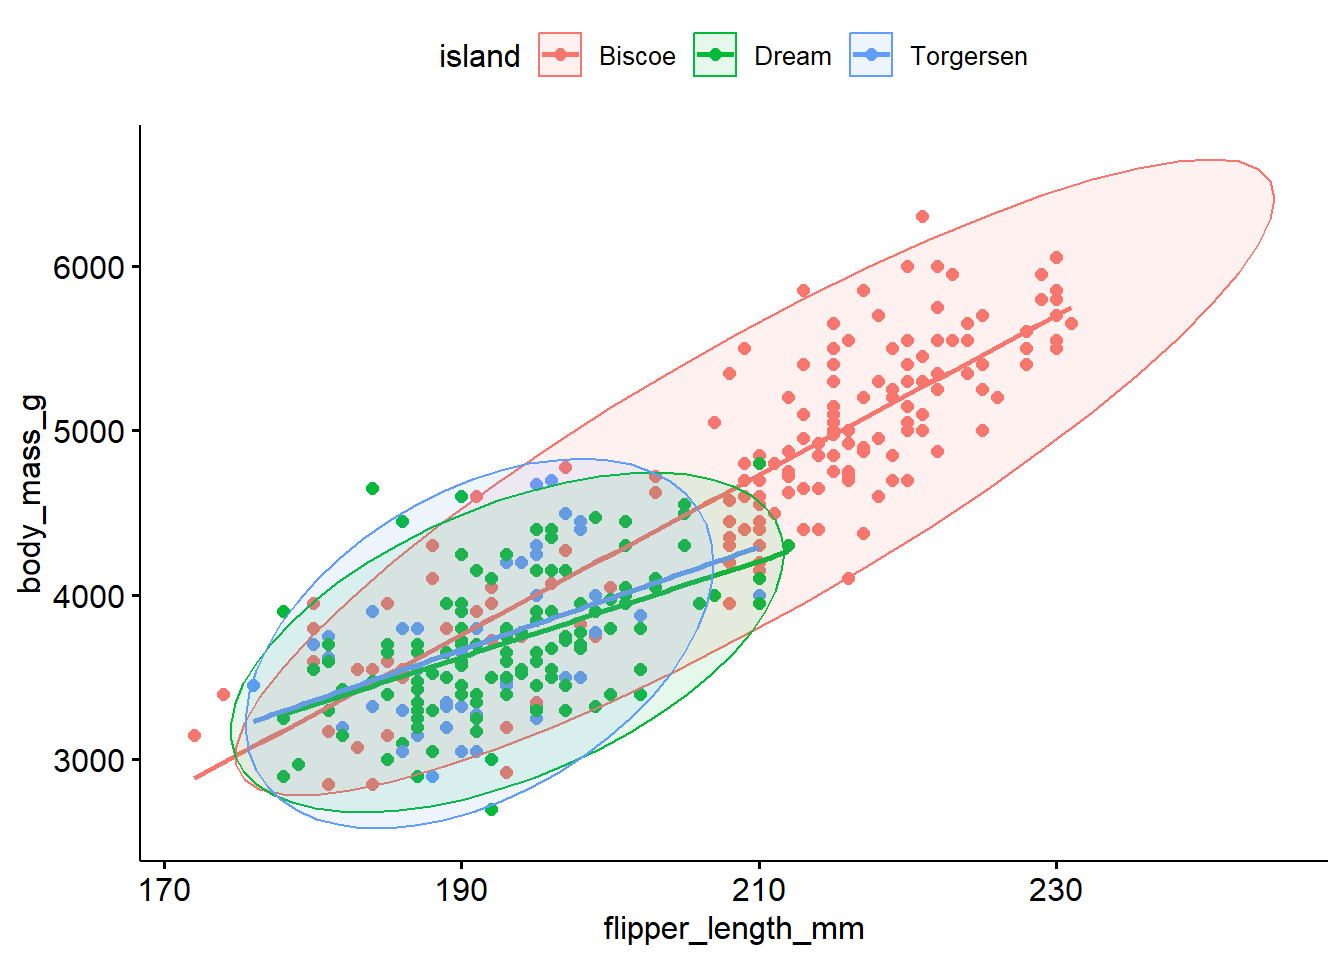
Probably, but the relationship between flipper length and body mass changes depending on what island they are found on.
overall
stratified by species
by(pen, pen$species, function(x){
  cor(x$flipper_length_mm, x$body_mass_g, use="pairwise.complete.obs")
})
## pen$species: Adelie
## [1] 0.4682017
## ------------------------------------------------------------
## pen$species: Chinstrap
## [1] 0.6415594
## ------------------------------------------------------------
## pen$species: Gentoo
## [1] 0.7026665
There is a strong, positive, linear relationship (r=.87) between the flipper length and body mass of penguins when ignoring the species. This association is attenuated however within each species. Gentoo and Chinstrap still have strong correlations between flipper length and body mass, \(r\)=.70 and .64 respectively. However Adelie species penguins only have a moderate correlation with \(r=.45\).
So does Species moderate the relationship between flipper length and body mass? Visually we see a difference, but it is likely not statisticaly significant. More on how to determine that in section 10.2.